



A spreadsheet can contain the right answer and still be difficult to communicate.
That is often where infographic video production begins. A marketing team may already have the numbers, product logic or process mapped internally, but once those points need to reach customers, employees or stakeholders, too much information starts competing for attention.
For brands considering infographic video production in Singapore, the production challenge is not simply turning charts into motion. It is deciding what viewers need to notice first, what deserves more time on screen and what can be removed without weakening the message.
At SuperPixel, we treat that hierarchy as part of production. The animation comes after the information has a clear order. That is also why effective visual communication begins with deciding what the audience should understand before deciding how polished the graphics should look.
What Is a 2D Infographic Video?
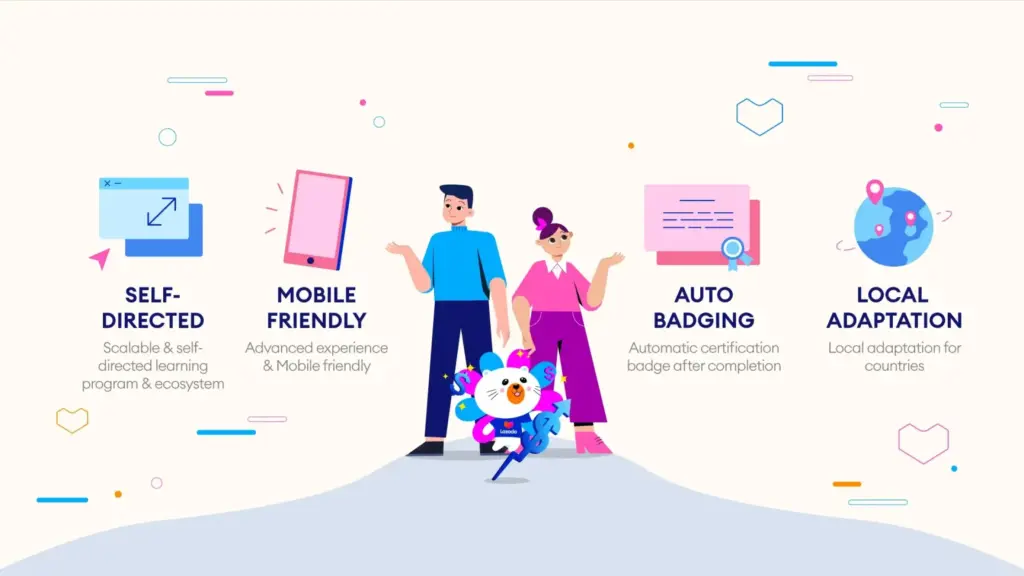
A 2D infographic video uses motion graphics, typography, charts, icons, diagrams and visual sequencing to explain structured information over time.
If you are unfamiliar with the format itself, it helps to start with what an infographic is before considering what animation adds to it.
That makes it different from simply animating a static infographic.
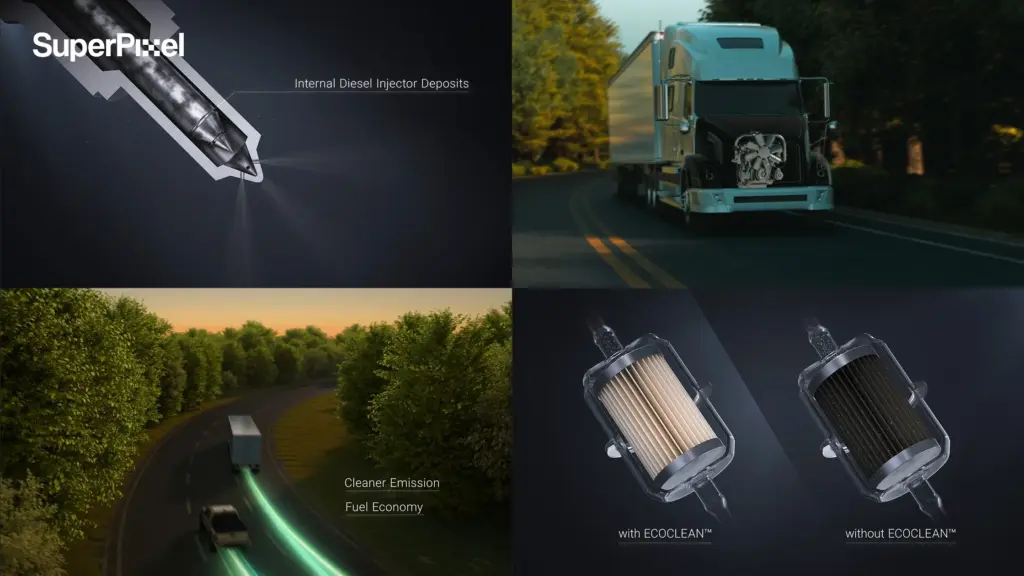
The movement has a communication job. A number can appear after its context is established. One bar can grow before the comparison enters. A process can reveal one stage at a time instead of asking viewers to decode the entire system in one frame.
This is the main difference between a static graphic and an animated infographic: time becomes another tool for controlling information hierarchy.
It also differs from broader motion graphics, where the goal may be branding, atmosphere or visual energy. Infographic animation has a narrower responsibility: make information easier to follow in the order that matters.
This format is particularly useful for:
- product and service explanations;
- financial or performance information;
- process and workflow communication;
- corporate and internal communications;
- comparisons and before-and-after stories;
- reports, research and campaign statistics;
- services or systems that are difficult to film directly.
The common thread is not the industry. It is the need for hierarchy.
For more examples of how this format can be used, our guide to animated infographic videos explores several ways structured information can be translated into motion.
When Infographic Animation Is More Useful Than Static Renders or Live Action
Not every information-heavy brief needs animation.
If your audience only needs to reference a set of figures at their own pace, a static infographic, report or interactive infographic may be more practical. Interaction is particularly useful when people need to explore different parts of the information rather than follow one fixed sequence.
Live action may also be the stronger format when trust depends on a real person, workplace or customer story. A founder explaining a new direction or an employee discussing an internal initiative can communicate something a chart cannot.
The choice between animation and live action should therefore start with the communication job, not a preference for one production technique.
Infographic animation earns the additional production effort when sequence changes understanding.
Imagine presenting three years of business growth. A static chart shows the final comparison immediately. An animated chart can establish the baseline, reveal the change and then hold the number that matters.
The information is the same. The viewing experience is not.
The same applies to processes. When viewers need to understand what happens first, what changes next and where the outcome appears, animation lets the production team control that sequence precisely.
That is where 2D animation becomes useful rather than decorative. It allows information to appear in stages without forcing every relationship into a single frame.
Start With the Information, Not the Style
One of the easiest ways to make an infographic video expensive is to begin visual development before the information is settled.
A brand moodboard cannot solve an unclear hierarchy.
Before storyboarding, we want to know which claims matter, which numbers are approved, what the audience already understands and what they are likely to misunderstand.
This is where animation scripting can be just as important as visual design. Even when the final piece contains little narration, someone still needs to determine the order in which each claim, comparison and supporting detail appears.
For data-heavy projects, source material matters too.
If a percentage appears on screen, someone should know where it came from. If the video compares two products, plans or results, the basis for that comparison should already be approved.
This becomes especially important for finance, healthcare, public information and corporate animation where legal or compliance teams may need to review precise wording.
Changing a colour late is straightforward. Changing the meaning of a chart after animation has begun is not.

How Data Should Move on Screen
Good infographic animation is often quieter than expected.
The goal is not to keep everything moving. It is to decide when movement helps the audience understand the information.
The same principle applies more broadly across motion design and animation: movement should create hierarchy or meaning rather than simply prove that something can move.
Give one comparison the lead
If one number matters most, establish that hierarchy visually.
A bar can grow first while secondary values remain muted. A percentage can hold on screen before supporting copy arrives. A comparison can reveal one state before showing the second.
When five elements enter at the same time with equal weight, the viewer has to decide what to ignore.
That decision should belong to the production team, not the audience.
Looking at different motion graphics examples can also be useful here. The strongest examples typically control when information arrives rather than filling every second with movement.
Treat typography as part of the animation
Type size, line length, entry timing and hold time determine whether information can actually be read.
A headline should usually establish the point before supporting labels compete for attention. If a number only remains visible for a second, the viewer may technically see it without having time to process it.
Typography, layout and hierarchy are part of graphic design before they become animation decisions.
This becomes even more important when the video needs to work silently.
For social feeds, event screens or internal channels where sound cannot be guaranteed, captions and visual hierarchy may need to carry the story without voiceover.
Decide how the video will be watched early
A widescreen video inside a presentation behaves differently from a vertical social cut.
Charts may need different proportions. Labels may need to move. Text that works comfortably on a laptop may feel too small on mobile.
If social distribution matters, planning for social media animation before production begins can prevent vertical and square versions from becoming awkward crops of the master video.
If multiple versions are required, plan them before detailed animation begins rather than treating each one as a simple export later.
For presentation-led communication, a slide deck animation may even be a more practical format when the audience needs information to remain connected to slides rather than exist as a standalone video.
What Should Be Approved at Storyboard Stage?
For infographic video production, the storyboard is not just an illustration preview.
It is where the communication structure should become testable.
A strong animation storyboard lets the client and production team test information order before detailed motion work begins.
Before animation starts, your team should be able to review:
- what each scene is trying to communicate;
- which number, label or comparison gets priority;
- whether the chart type supports the point;
- how narration and on-screen text divide the explanation;
- whether legal or compliance wording is accurate;
- how much information appears at the same time;
- which scenes may need adaptation for other formats.
If your team is new to this stage, our guide on how to storyboard an animation explains how the script and visual sequence are translated into individual scenes.
You can also read our broader storyboard explanation for the role storyboards play across different video and animation projects.
This is also the least expensive stage for structural changes.
If a comparison feels confusing in storyboard form, improving the illustration will not solve the underlying problem. The sequence needs to change.
For many projects, two or three storyboard review rounds can be useful before animation begins. The exact number depends on the brief and approval structure, but the goal is consistent: resolve message and hierarchy before motion makes those decisions more expensive to revisit.
What Affects Timeline and Production Scope?
Runtime matters, but it is rarely the only meaningful scope driver.
A 60-second video built from simple branded icons can require less production than a shorter piece containing custom data visualisation, complex diagrams and several output formats.
The broader animation process is useful context here because scripting, storyboarding, design, animation, approvals and delivery each create their own dependencies.
The biggest variables often include:
Data and content preparation
A clean, approved dataset moves quickly. Raw spreadsheets, conflicting numbers or incomplete source material create more work before visual production can begin.
Illustration requirements
Existing brand assets may be enough for one project. Another may require a complete custom icon system, maps, diagrams or illustrated environments.
Projects that rely heavily on bespoke visual systems can move closer to dedicated 2D animation services, particularly when the team must create the visual language from scratch rather than animate supplied assets.
Number of information states
A chart with one reveal is different from a sequence containing several comparisons, transitions and explanatory states.
Versions and aspect ratios
A master 16:9 video plus square, vertical and silent versions requires additional layout decisions and review.
Approval structure
One coordinated client team usually moves more predictably than several departments reviewing different parts of the video at different times.
For a bespoke 2D infographic video, a production schedule may run roughly six to ten weeks from a locked brief through concept, storyboard, design, animation, feedback and delivery.
The exact timeline should follow the scope, not a standard promise.
Cost follows the same logic. Our guide to how much animation costs looks at why runtime alone cannot explain the final production budget.
For another reference point, the animated video cost guide looks more specifically at how different production choices affect animated video pricing.
What Should Singapore Teams Prepare Before Production?
You do not need to hand an animation studio a finished script.
You do need enough source material to identify the real communication problem.
Useful inputs include:
- approved data and its source;
- existing presentations or reports;
- brand guidelines;
- product or service information;
- audience and communication objective;
- legal or compliance requirements;
- intended distribution channels;
- required aspect ratios or versions;
- launch date;
- internal approval owners.
It is also worth bringing examples of confusion.
Which chart always needs explanation in meetings? Which product feature takes three slides to describe? Which part of the process causes customers to ask follow-up questions?
Those are often better creative starting points than a folder of visual references.
If the information is specifically tied to showing how a product works, a product demo video may be worth considering alongside an infographic-led approach. The right choice depends on whether viewers need to understand the product interface, the underlying logic, or both.
How to Choose an Infographic Video Production Partner in Singapore
A showreel can tell you whether a studio produces polished work.
It does not tell you whether the studio can organise a complicated brief.
When comparing partners, ask how they would approach the information before discussing animation style.
A useful production conversation should cover audience, data hierarchy, viewing context, compliance requirements, storyboard approvals and future versions.
Ask to see work where information became easier to follow, not just work with attractive motion graphics.
You can also compare how a studio approaches broader digital animation services. The useful question is not how many animation styles it offers, but whether it can choose a visual approach that fits the communication problem.
You can also learn a lot from the questions a studio asks.
Do they want to know which number matters most? Whether the video must work silently? Which claims are still awaiting approval? Who signs off the storyboard? Whether the same material will later be adapted into social cuts?
Those questions reveal whether the studio is thinking beyond the final render.
For SuperPixel, that is where infographic video production starts: making the communication structure clear enough that animation has a specific job to do.
If your brief is broader than charts and data, our motion graphics services may be a better starting point for exploring how typography, illustration and movement can support the wider campaign.
Frequently Asked Questions
Can one infographic video be adapted into widescreen, square and vertical versions?
Yes, but it is easier when the formats are planned before animation begins. Charts, labels and typography may need different compositions rather than simple cropping.
When social is a primary channel, it can also help to look at how social media animation videos are designed around shorter attention windows and different aspect ratios.
What should legal or compliance teams review?
They should review statistics, comparisons, claims, labels, disclaimers and relevant voiceover wording. Ideally, those approvals happen during script and storyboard development.
Do we need final data before storyboarding begins?
The most important figures and claims should be stable. Placeholder data can sometimes be used during early planning, but late numerical changes may affect charts, timing and scene composition.
Can we update the video when the data changes?
Usually, yes, depending on how the project is built and what needs to change. If regular updates are expected, discuss editable assets and future update requirements during the initial scope.
Should we request editable project files?
If your internal team expects to make future changes, ask about project-file handover before production begins. Source-file ownership and delivery can vary between studios and project agreements.
Planning a Data-Heavy Video?
Start with the information your audience needs to understand, not the number of graphics you want to animate.
Share your source material, audience, approved claims and intended channels with SuperPixel. We can help determine whether infographic videos, a broader motion graphics approach or another format gives the message the clearest structure.
Explore our 2D animation services and selected SuperPixel projects, or contact the team to discuss your brief.